


Data visualization through heatmaps has revolutionized how organizations understand customer behavior in digital environments. This graphical representation uses colors to indicate areas of higher interaction on a website or page.
The technology behind heatmaps allows for the translation of complex behavioral data into easily identifiable patterns, facilitating data analysis and strategic decision-making. With roots dating back to the 19th century, this technique has evolved significantly, becoming an essential tool for digital performance analysis.
Implementing heatmaps is strategic for organizations seeking to optimize user experience based on measurable behavioral evidence. To learn more about how heatmaps can be used, you can visit the Rock Content article , which offers valuable insights on the topic.
Furthermore, systematic analysis of the patterns revealed by heatmaps allows for the identification of optimization opportunities that directly impact critical business metrics. For a more in-depth analysis of data analytics tools, we recommend the Doisz article.
Main points
- Heat maps are graphical representations that use colors to indicate areas of greatest user interaction.
- Heat mapping technology makes it easy to visualize behavioral data.
- The origin of heat maps dates back to the 19th century.
- Implementing heat maps is strategic to optimize the user experience.
- Analyzing the patterns revealed by heat maps allows you to identify optimization opportunities.
What is a heatmap and how does it work?
User behavior analysis is significantly enhanced with the use of heatmaps . These visual tools are designed to simplify the understanding of complex data by presenting it in a clear and concise manner.
Heatmaps are particularly useful in analyzing websites and products, as they help identify areas of high and low user interaction. This is done using a color scale ranging from red to blue, where warm colors (red) indicate high activity and cool colors (blue) represent low activity.
Definition and origin of heat maps
Heatmaps originate from the analysis of complex data and are widely used in various fields, including marketing and user behavior analysis. Implementing heatmaps allows companies to better understand how users interact with their products or websites.
The definition of a heat map is directly related to its ability to visually represent data, making it easier to identify patterns and trends.
Visual representation of data through colors
The visual representation of data through color is a fundamental aspect of heatmaps . The choice of colors is strategic, using a gradient that ranges from blue (cool) to red (warm). This color scale helps to highlight areas of high and low interaction, allowing analysts to quickly identify points of interest.
The psychology of color also plays an important role in the interpretation of heat maps , as different colors can evoke different emotional responses in users.
Types of heat maps for behavior analysis
There are different types of heatmaps , each providing unique insights into user interaction. These maps are valuable tools for understanding how users behave on a web page.
Click and tap maps
Click and touch maps are used to identify the points on a page that users click on most frequently. This helps to understand what attracts the user's attention and what they consider important. By analyzing these maps, it is possible to identify areas of high interaction and optimize page elements to improve the user experience.
Scroll maps
Scroll maps show how far users scroll down a page. This is crucial for understanding whether important content is being seen or ignored due to its location on the page. With this information, it's possible to adjust the page layout and structure to ensure that the most relevant content is visible without requiring excessive scrolling.

Move maps
Motion maps track the movement of the mouse cursor across the page, providing insights into how users navigate and what catches their attention. This can help identify behavioral patterns and areas of interest.
Engagement Zones and Rage Click Maps
Engagement zones combine interaction data from different heatmaps, offering a unified view of user behavior. Anger click maps, on the other hand, identify areas where users click repeatedly, indicating frustration or confusion. By analyzing these maps, it's possible to identify problem areas and improve the user experience, increasing conversions.
By using these different types of heatmaps , it is possible to gain a comprehensive understanding of user behavior and make informed adjustments to improve the usability and effectiveness of a web page.
How to Create a Heatmap for Your Website
To understand how users interact with your website, creating a heatmap is essential. This involves several steps that ensure accurate data is collected about user behavior.
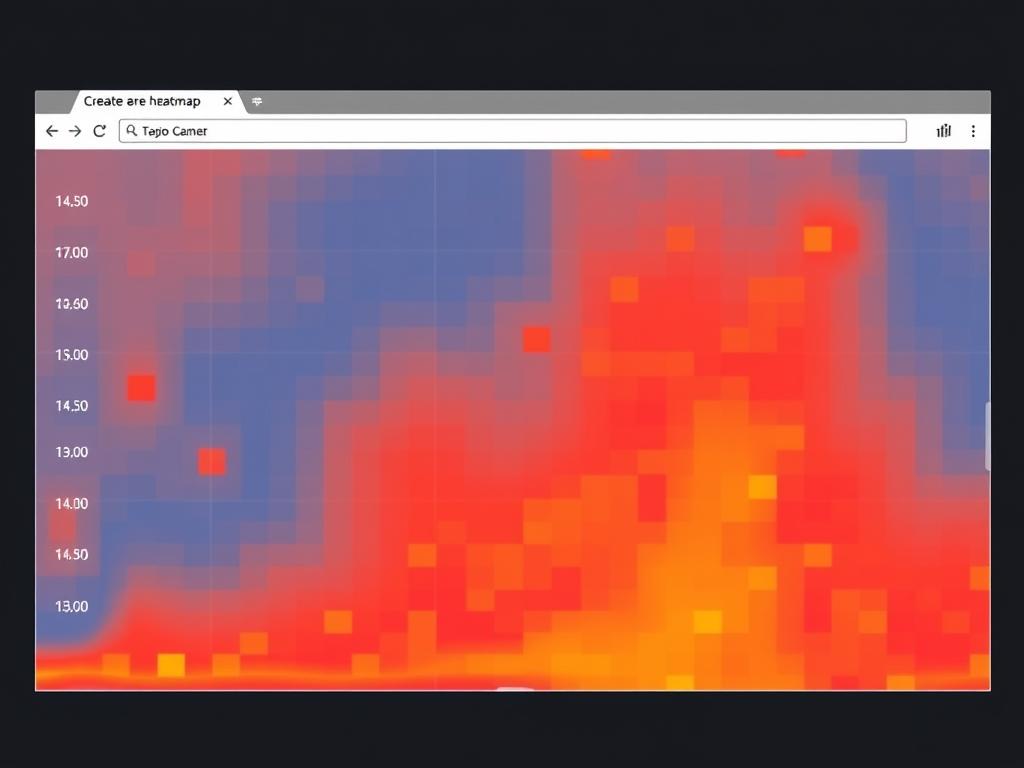
Tools available for generating heat maps
There are several tools available for creating heatmaps, with Hotjar being one of the most popular. It offers free and paid plans with different analytical capabilities, allowing you to choose what best suits your needs.
Optimizing your website with tools like Hotjar can significantly improve user experience and increase conversions.
Step by step guide to setting up your first heatmap
The process of setting up a heatmap follows a few structured steps:
- Create an account on the platform of your choice, such as Hotjar.
- Install the tracking code on your website, either directly in the source code or through integrations with content management systems like WordPress.
- Enable session capture to ensure proper collection of behavioral data.
- Define the specific URLs you want to analyze, which can be individual pages or multiple pages with a similar structure.
- Streamline your analysis by setting up filters to target by date range, device, specific behavior, or custom user attributes.
By following these steps, you can create an effective heatmap that provides valuable insights into user behavior on your website.
Interpreting Heatmap Data
Interpreting heatmap data is crucial for understanding how users interact with a website. Heatmaps help identify areas that attract more attention and those that are ignored, providing valuable insights for improving user experience and increasing conversion rates.
Identifying user behavior patterns
Strategic heatmap analysis allows for the precise identification of points of interest that concentrate user attention and interaction. This reveals elements that naturally attract engagement and can be leveraged for conversion goals. Furthermore, the correlation between page positioning and engagement level often reveals predictable patterns.
For example, it's common to observe that users' attention is focused on the top of the page and the first third of the scrolling, with a progressive decrease in engagement with content positioned below the fold. This information is crucial for optimizing content and improving the user experience.
| Page Positioning | Engagement Level |
|---|---|
| Top of Page | High |
| First Third of Roll | Medium-High |
| Below the Fold | Low |
Recognizing points of interest and ignored areas
Equally important is the systematic identification of ignored areas – regions of the interface that receive little or no attention despite containing information or elements that are potentially important to the user journey or business objectives. Comparative analysis between points of interest and strategic objectives of the page allows for the identification of alignments and discrepancies between expected and actual behavior.
This guides decisions about repositioning critical elements to areas of greater visibility and helps eliminate distractions or transform points of interest into functional elements aligned with strategic objectives.
Practical applications of heatmap in customer analysis
Using heatmaps allows for detailed analysis of customer behavior across different devices. This is crucial for understanding how users interact with the content and elements of a web page.
Heatmaps are particularly useful for identifying areas of high and low interaction, allowing marketers to optimize their strategies based on observed behavior patterns.
Optimizing page elements and CTAs
Heatmap analysis helps identify which page elements are attracting user attention and which are being ignored. This allows for the optimization of page elements and CTAs (Call-to-Actions) to improve conversion rates.
Additionally, heatmaps can be used to compare the performance of different versions of a page, helping to determine which layout is most effective.
Identifying usability problems
Heatmaps are also useful for identifying usability issues on a website. For example, if users are having trouble finding a certain element or if they are being distracted by irrelevant elements.
By analyzing heatmaps, it is possible to identify areas where users are “struggling” to interact with the website, allowing developers to make necessary adjustments to improve the user experience.
Performance comparison between devices
Comparing heatmaps across different devices, such as desktop and mobile , is crucial for understanding how users interact with a website in different contexts.
| Device | click through rate | Rollover Rate |
|---|---|---|
| Desktop | 25 % | 70 % |
| Phone | 30 % | 50 % |
| Tablet | 20 % | 60 % |
By understanding these differences, marketers can tailor their strategies to meet the specific needs of each user group, thereby improving the overall user experience.
Strategies to improve user experience based on heat maps
Using heatmaps is a strategic approach to understanding user behavior on a website. These maps provide a clear visual representation of how users interact with different page elements.
Based on the insights gained from heatmaps , it's possible to implement various strategies to improve the user experience. One of these strategies involves repositioning important elements within the page.
Repositioning of important elements
Analyzing heatmaps can reveal that certain crucial elements, such as CTA (Call to Action) buttons, are not being noticed by users due to their location on the page. Revising the layout of these elements can significantly increase conversion rates.
Elimination of distractions and non-functional elements
Heatmaps also help identify areas of the page that receive little or no interaction. This can indicate the presence of distracting or non-functional elements that may be detrimental to the user experience. Removing or redesigning these elements can improve navigation and engagement.
A/B testing based on heatmap insights
Implementing A/B testing based on insights gained from heatmaps is an advanced optimization methodology. This allows combining qualitative behavioral analysis with quantitative statistical validation, maximizing the website's conversion potential.
- The data-driven approach to A/B testing allows the formulation of statistically relevant hypotheses.
- Implementing multivariate testing speeds up the optimization process and allows the identification of complex interactions between different interface elements.
- The continuous cycle of heatmap analysis, hypothesis formulation, test implementation, and result validation establishes a systematic progressive optimization methodology.
Success Stories: Companies that transformed their results with heat maps
The use of heat maps has allowed companies to make decisions based on concrete data about user behavior. This approach has proven particularly effective for many organizations looking to improve user experience and increase conversions.

Increase conversions through behavior analysis
One exemplary case involves a technology company that identified, through motion maps , patterns of confusion in the initial navigation of its homepage. Restructuring the information architecture based on these insights resulted in a 43% reduction in bounce rate and a 2,7-minute increase in average session time.
Furthermore, a financial institution used click maps to identify which non-clickable visual elements were receiving frequent interaction attempts. Transforming these elements into functional links reduced the bounce rate by 29% and increased the average number of pages per session by 3,4. For more information on how to optimize page elements, visit our article on CTAs that sell.
Reducing bounce rate with data-driven optimizations
Systematic analysis of heat maps allowed a retail company to identify that critical product availability information was being overlooked. The strategic repositioning of this information resulted in a 38% reduction in shopping cart abandonment rates.
These cases demonstrate how implementing optimization strategies based on heat map data can establish measurable correlations between specific interventions and increased user dwell time and engagement.
Conclusion
Heatmaps are emerging as an essential tool for understanding user behavior and optimizing the website experience. By offering an intuitive visualization of data , they allow for the identification of behavioral patterns and areas of interest, facilitating evidence-based decision-making.
The strategic implementation of heatmaps enables the identification of optimization opportunities, improving the user journey and increasing retention. Furthermore, continuous analysis via heatmaps establishes a culture of progressive improvement, resulting in consistent increases in critical business metrics.
Therefore, heatmaps are fundamental for organizations committed to data-driven optimization, transforming digital interactions into actionable insights and driving results.
FAQ
What is a heatmap and how can it help you understand user behavior?
A heatmap is a visual representation of data that uses colors to illustrate user interaction with a web page or application, allowing you to identify areas of high engagement and usability issues.
What are the main types of heat maps used in behavior analysis?
The main types include click and tap maps, scroll maps, move maps, and engagement zones, which provide insights into how users interact with content.
How do I create a heatmap for my website?
To create a heatmap, you need to use specialized tools, such as Hotjar, which allow you to configure and generate visualizations of user interaction data on your website.
What are the main practical applications of heat maps in customer analysis?
Heatmaps are used to optimize page elements and CTAs, identify usability issues, compare performance across devices, and improve user experience.
How to interpret heatmap data?
Interpretation involves identifying patterns of user behavior, recognizing points of interest and overlooked areas, and using these insights to make informed decisions about improving the user experience.
What strategies can be implemented based on heatmap insights?
Strategies include repositioning important elements, eliminating distractions and non-functional elements, and conducting A/B testing based on heatmap insights to improve the user experience.
Is it possible to use heatmaps to compare performance between different devices?
Yes, heatmaps allow you to compare how users interact with your website or app across different devices, helping you identify platform-specific issues.